Engaging annual reports can boost interaction by up to 3x, featuring dynamic elements such as interactive graphs, video snippets, and captivating animations.
Companies that use interactive reports see up to a 70% longer average reading time compared to static classic PDFs keeping audiences deeply engaged.
3x
Interactive annual reports generate up to 3x more engagement through features like clickable charts, embedded videos, and animations
35%
Readers recall 35% more information from interactive reports than from static ones resulting in stronger knowledge retention.
Case studies
See How We’ve Helped
Others Inspire Donors
ONE MILLION degrees
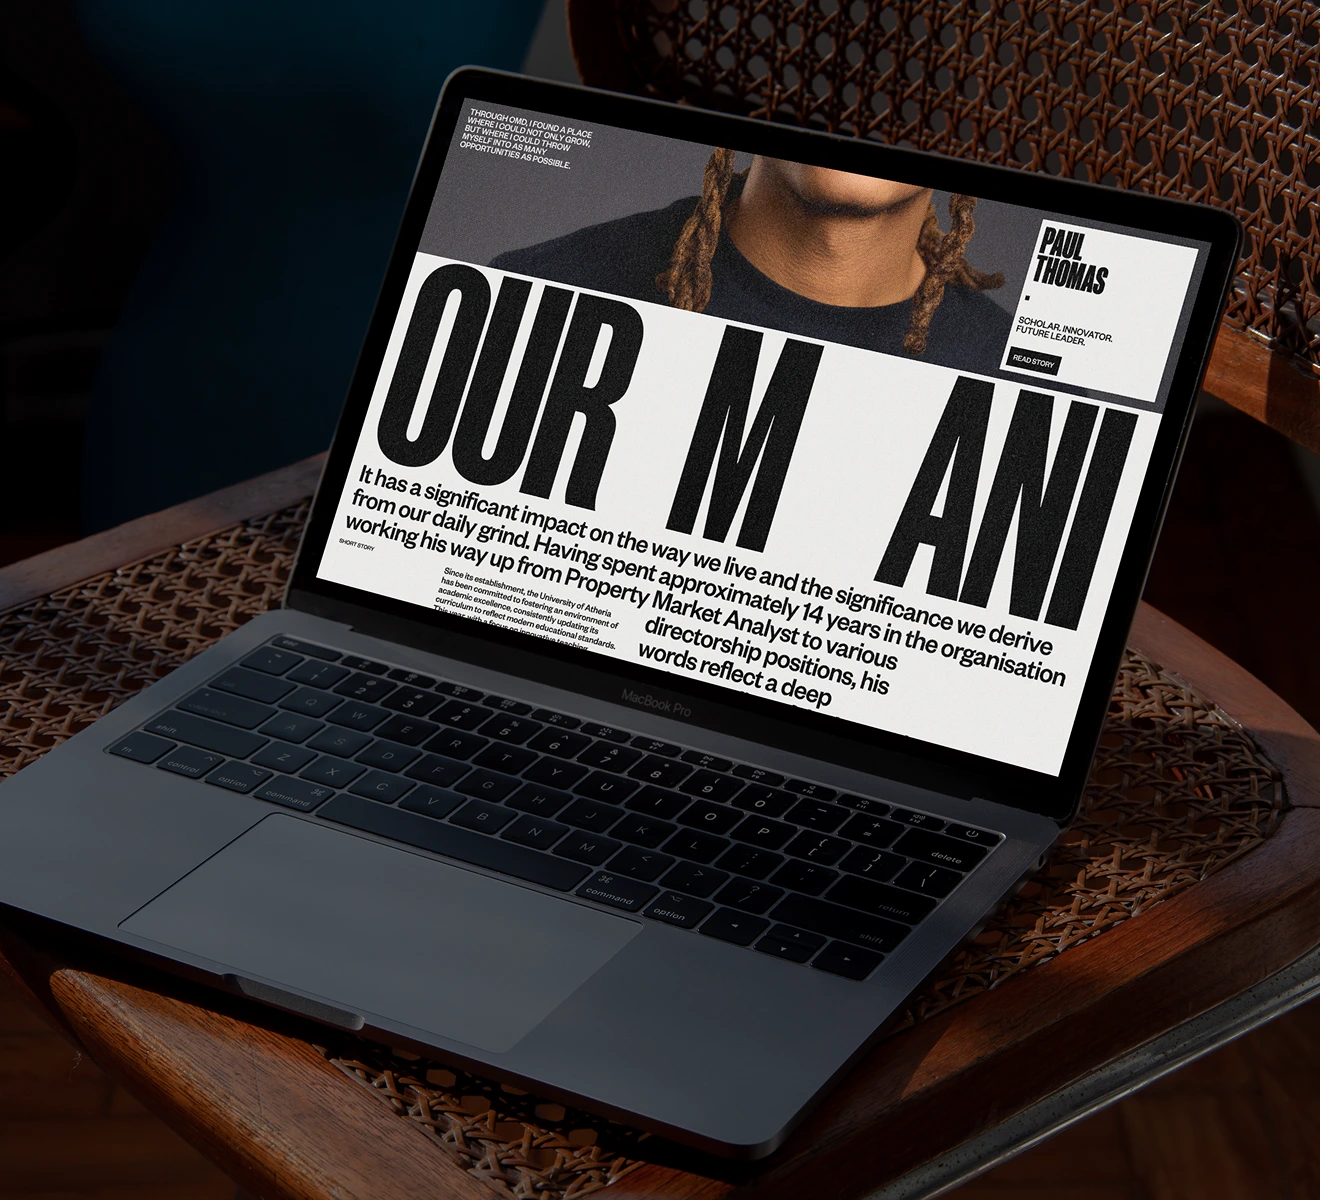
An interactive microsite showcasing the impact of OMD’s sponsor partnerships.
We created an interactive microsite that brings OMD’s sponsor partnerships to life combining focused storytelling, strong visuals, and mixed media elements to highlight their impact and shared mission.
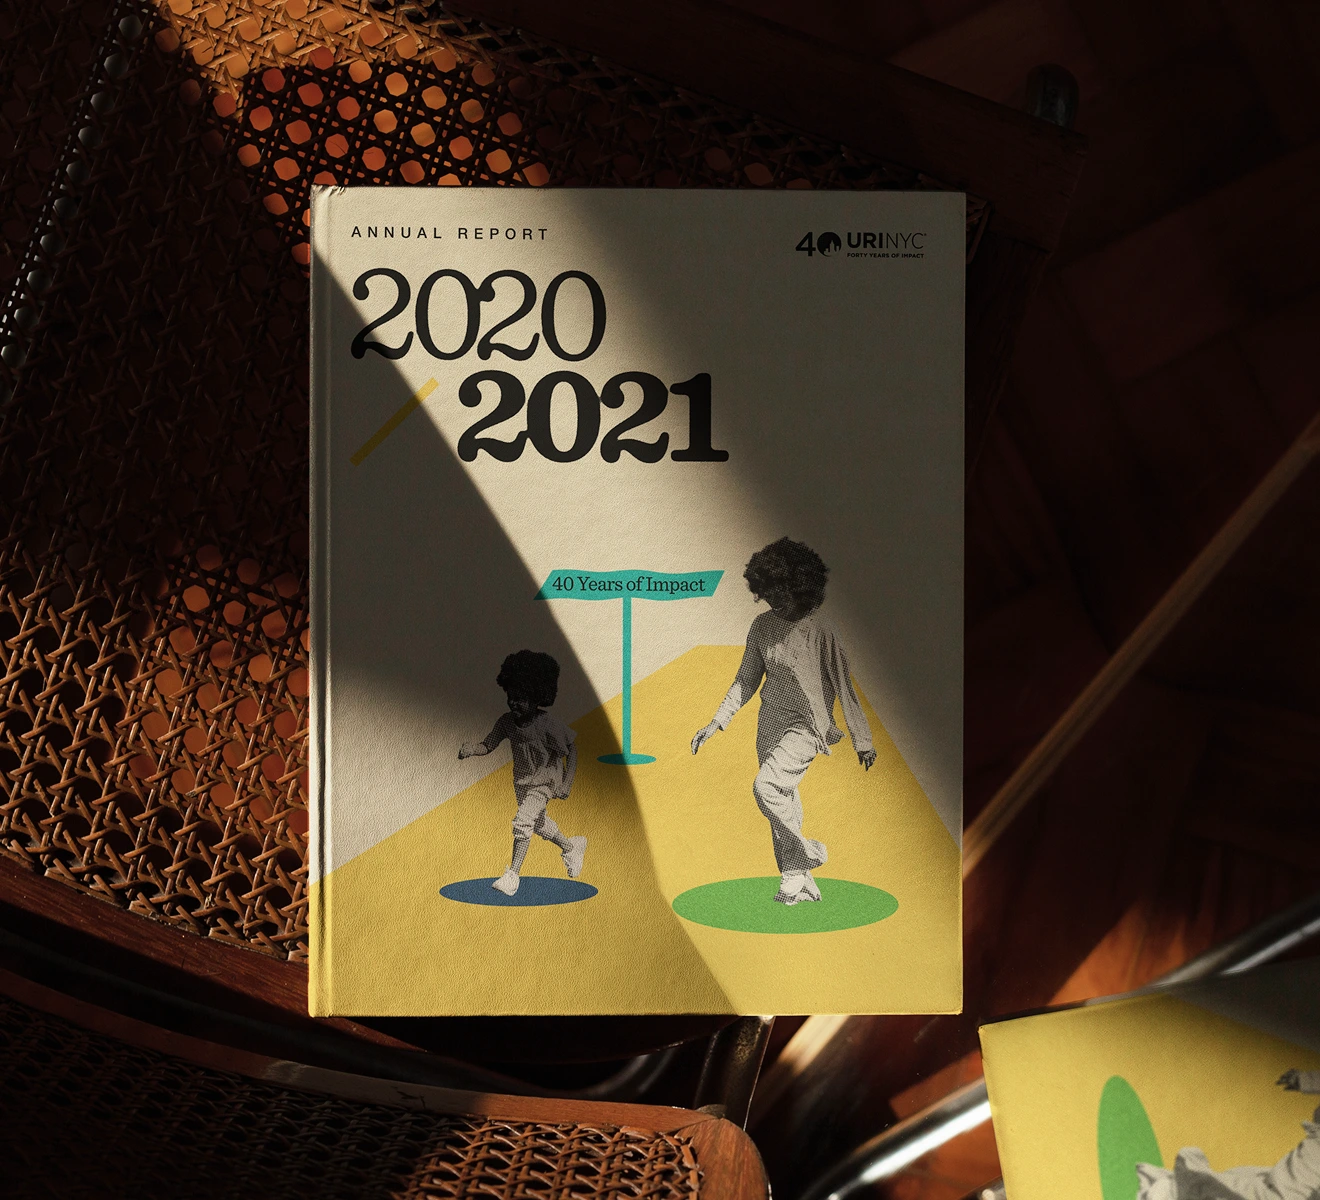
We partnered with Urban Resource Institute (URI) to design their annual report—an essential piece of print and digital collateral that highlights a year of impact. By bridging their established visual identity with a more contemporary design language, we helped URI communicate their 12-month results with clarity, confidence, and renewed brand presence.
What’s the difference between a PDF, print, and microsite annual report?
Print reports are polished, physical pieces often used for high-end donors and events. PDFs are branded, shareable files ideal for broad digital distribution. Microsites are interactive, web-based experiences with multimedia storytelling—quickly becoming the preferred choice for nonprofits that want to stand out and engage donors online.
Can you also handle the writing and content for our annual report?
Yes. While many nonprofits provide their own copy, we can collaborate on content strategy, editing, and structuring your report for clarity and impact. We focus on making complex impact data easy to understand and compelling for donors.
Is there a pricing advantage if we want a print, digital, and microsite annual report together?
Yes. Many nonprofits choose a bundle package for efficiency. Since the content, design system, and storytelling are consistent across formats, we streamline the process to reduce duplication. This creates cost savings compared to commissioning each format separately. For example, a nonprofit that invests in a microsite can often get a polished PDF and print version at a reduced rate because the core design assets and content have already been developed.
What makes Oak Theory’s annual reports different?
We specialize in boutique, custom design that blends strategy, storytelling, and innovation. Unlike templates or cookie-cutter reports, we create custom experiences that inspire donors, build trust, and help nonprofits stand out.
How long does it take to create an annual report?
Most nonprofit annual reports take 6–10 weeks from kickoff to final delivery, depending on format (print, PDF, or microsite) and how quickly content is provided. Microsites often require additional time for interactive features and testing.
Ready to turn your annual report into an experience that inspires donors and strengthens relationships?
(Reach Out)
Transform your report into more than numbers and charts by creating an engaging, interactive journey. With dynamic visuals, embedded stories, and intuitive design, your annual report becomes a powerful tool to inspire action and build lasting donor trust.